Pokemon Card Price History
Real historical price charts, not estimates. Every card page on Ripdex includes a 90-day price history built from daily TCGplayer market data, so you can see exactly where a card's value is heading before you buy, sell or trade.
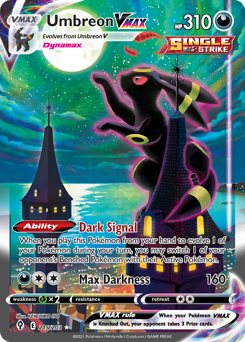
Umbreon VMAX · Evolving Skies #215 · $2,264.70 (-4.4% / 30d)
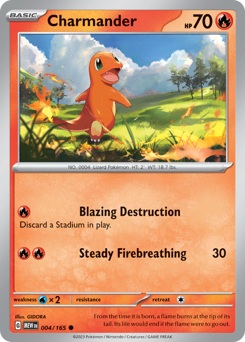
Charmander · 151 #4 · $0.69 (+17.4% / 30d)
Bulbasaur · Mega Evolution #1 · $0.58 (+27.8% / 30d)

How to Read Pokemon Card Price Charts
- Trend beats snapshot. A single day's price tells you little; the 30-day trend tells you whether you're buying into a peak or a dip.
- Set lifecycle matters. New sets typically open high, dip as supply floods in over the first months, then recover for chase cards as boxes dry up.
- Spikes need a reason. Sudden jumps usually track tournament results, social-media attention or reprint news, so check before chasing a spike.
- Volatility is information. The Investment Analysis block on each card page shows 90-day volatility; steadier cards are safer holds.
Find any card's chart via the price checker, or scan the card with the app and jump straight to it.
Track price history for your whole collection
Scan your cards with Ripdex and watch their value move day by day.